In 2020, California voters will be asked to weigh in on some of the most contentious and consequential issues facing the state — criminal justice reform, rent control, school construction funding and inequality. For those hoping to make sense of the deluge of political polls and they’re likely to see over the next year, consider this a handy user guide.
A new CalMatters analysis of survey data from the Public Policy Institute of California found, if history is a guide, that voters and other poll watchers can expect a few things.
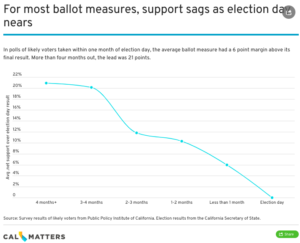
- Support generally sags. The public’s net support for ballot initiatives (that is, how much public support exceeds opposition) declined by an average of about 7 percentage points each month. An equivalent change would be an initiative polling with 53% in support to 47% against in October, but then narrowly losing in November.
- There are exceptions. While 71% of the measures analyzed became less popular as election day approached, voters warmed to the other 29%.
- It depends on the measure. Voters have been quicker to sour on measures that tinker with education policy and raise taxes, but more steady on bond measure and tax decreases.
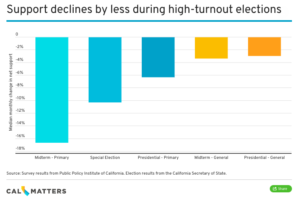
- It also depends on the election. The biggest drop off in net support for a measure occurred during low-turnout, non-presidential years.
Our number-crunching was motivated by a simple question: When is a good poll still bad news?
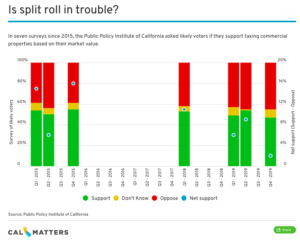
For years, a fairly consistent majority of Californians polled by the institute has backed hiking property taxes on longtime commercial landowners.
The concept, known in policy shorthand as “split roll,” would require businesses to pay property taxes based on the current market value of their buildings and land, rather than on the initial purchase price. In short, it would be a massive tax increase on business, raising billions for local school districts and governments.
But that sizeable base of support appeared to take a hit earlier this month.
An October poll found that only 47% of likely voters support the idea of nixing the tax benefit for businesses, compared to 45% who oppose the idea. The remaining 9% weren’t sure.
On its face, that might not seem like such a bad thing for split roll supporters — public sector unions who would benefit from an extra $7 billion to 11 billion in estimated revenue and other progressives.
But according to many analysts and commentators, that 2% margin of support is actually awful news if you favor the November 2020 proposal.
That’s based on a bit of conventional wisdom, widely held among the types of people who fixate on such things, that support for ballot measures always declines the closer you get to election day.
Since 1998, the institute has asked Californians it deems “likely voters” about 80 ballot measures.
An examination of how opinion on each of those ballot measures has shifted over time—from polls as early as a year out from election day to the certified ballot box results themselves—shows that the conventional wisdom generally holds up.
The vast majority of ballot measures analyzed saw a decline in public support as election day approached. There were exceptions and the range was enormous, but the average worked out to 6.6% percentage points per month.
Why? The most common theory comes down to timing, said Dean Bonner, a survey director at the institute. A new policy proposal may sound good on paper. Then the attack ads and editorializing begins.
“Wherever a ballot measure campaign starts off, it’s starting off without there being a ‘No’ campaign,” he said.
A blog post from the California Chamber of Commerce gleefully made that point about the new survey on split roll, which it calls the “largest tax hike in history”:
“Support for a split roll initiative has dipped below 50%, even before facing a serious opposition campaign — and without any mention in the survey question that the initiative would alter Proposition 13, a landmark law most voters typically associate with popular residential tax protections.”
Lack of a counter campaign may help to explain why some measures fare better over time.
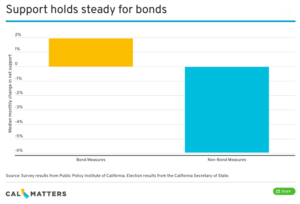
Support for bond measures, for example, tends to remain relatively steady through an election season. On average, support for these measures has actually inched up slightly. While there are plenty of interests willing to spend big in support of new financing for public infrastructure, with the exception of small government groups like the Howard Jarvis Taxpayers Association, there isn’t a huge anti-debt lobby.
No surprise then that bonds also have a disproportionately good track record at the ballot box. While only 35% of the 80 ballots analyzed ended up passing, 82% of bond measures were approved.
Another potential explanation why most ballot measures drift downward in the polls is the “cautious voter” theory. If voters aren’t sure about a big change to state law, the thinking goes, they’ll err on the side of caution and default to the ‘no.’
But without asking individual voters, it’s harder to say whether that actually happens. Ballot measures that elicited more shoulder shrugging in surveys prior to election day weren’t any more or less likely to see their support drop off — or to fail on election day.
All this might seem ominous to split roll supporters, but they do have two reasons to hold out hope.
First, ballot measure polls seem to overshoot the final election result the most during off-year elections. During midterm primary elections and other off-year contests, the typical measure saw a drop off in its net popularity by more than 10 percentage points. But in the run up to general election, particularly during presidential years, the decline was much more modest.
Second: there are exceptions to every rule. Nearly a third of ballot measures actually became more popular overtime.