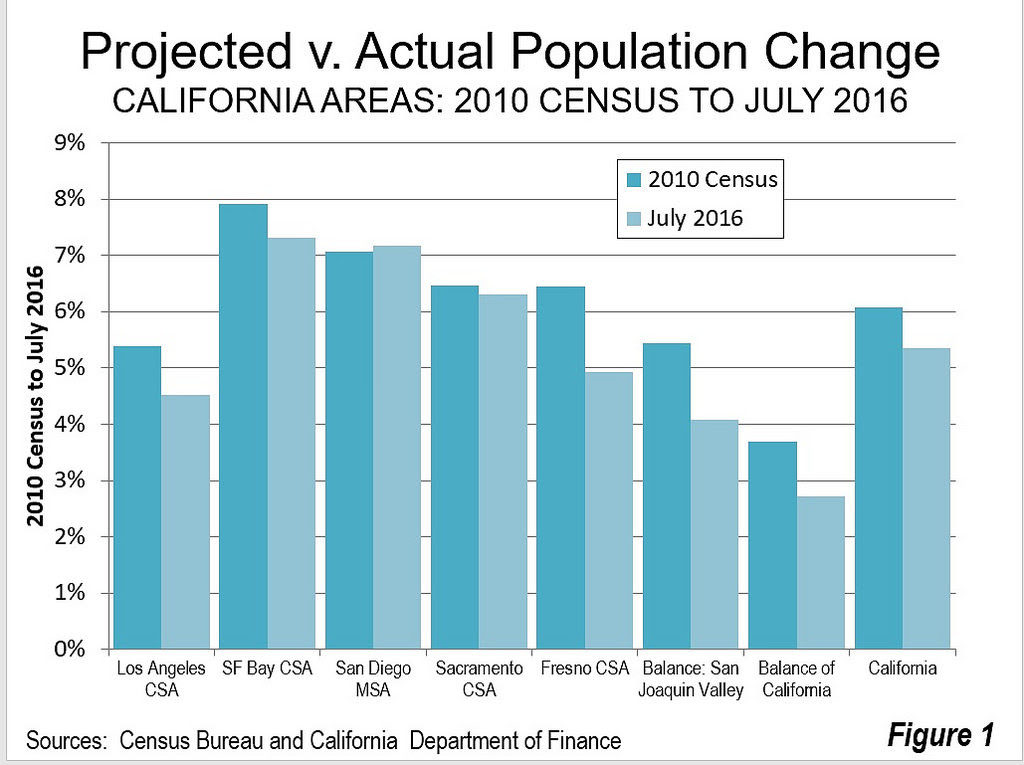
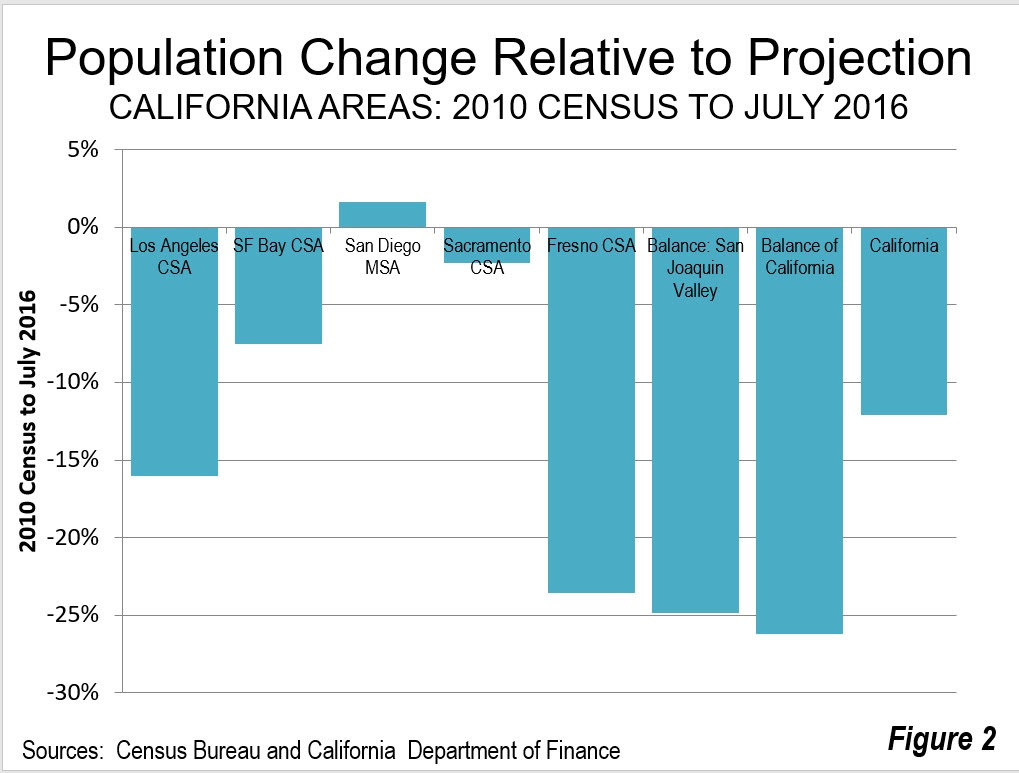
Halfway through the new decade, California, widely seen as an irresistible force for the young and ambitious, is underperforming the state’s own demographic projections. Since 2010 the state’s population grew 5.3 percent from the 2010 census figure, 12 percent below the 6.1 percent increase projected by the California State Department of Finance. The population increased at below projected rates in all of the five metropolitan regions (combined statistical areas, or CSAs and metropolitan statistical areas MSAs, outside the CSAs) with more than 1,000,000 population, except in San Diego.
This article compares the 2016 US Census Bureau population estimates of areas within California to the corresponding projections by the California State Department of Finance (DOF). The Census Bureau estimates are for July 1, 2016 and the Department of Finance projections are for January 1. As a result, the Census Bureau estimates are compared to the average of the California 2016 and 2017 projections. Moreover, the Census Bureau estimates are used because of their more authoritative nature. DOF calibrates its estimates to those of the Census Bureau at each 10 year national census. It is important to recognize that projections are just that — forecasts that can be significantly off even when demographers take the greatest caution to achieve accuracy.
The Los Angeles CSA
The population gain in the Los Angeles CSA was 4.5 percent between the 2010 census and July 1, 2016, 16.0 Percent below the projected 5.4 percent. The Los Angeles CSA includes Los Angeles, Orange, Riverside, San Bernardino and Ventura counties. Among these, only Riverside County exceeded its projection, by 5.1 percent. Los Angeles County fell 27.5 percent short of its projection and Ventura County was 20.3 percent short. San Bernardino County missed its projection by 14.7 percent, while Orange County was 10.3 percent short.
The San Francisco Bay Area CSA
The San Francisco Bay Area CSA also gained fewer new residents than expected, with its 7.3 percent increase following 7.5 percent short of the 7.9 percent projection. The San Francisco Bay Area CSA includes seven metropolitan areas: San Francisco, San Jose, Stockton, Santa Cruz, Vallejo, Napa and Santa Rosa. The San Francisco metropolitan area grew 4.2 percent less than its projection. This was driven by a shortfall of 27.9 percent in Marin County, 12.7 percent in San Mateo County and 6.4 percent in San Francisco County. Alameda County did slightly better than expected, while Contra Costa County did slightly worse.
Santa Clara County, home of San Jose, grew 13.7 percent less than projected. All of the outlying metropolitan areas fell short of their projections, except for Sonoma County, which grew 15 percent more than projected, probably in part due to its having among the least severely unaffordable housing in the area and having good access to employment centers of western Contra Costa County.
The San Francisco area’s failure to achieve its population projection is significant, given that Plan Bay Area assumed that the Bay Area would grow 54 percent more than the DOF estimates for 2010 to 2040. I raised questions about this assumption in a 2013 report for the Pacific Research Institute, that the failure to use the state projection was likely to exaggerate greenhouse gas emissions in 2040. The suspicion that Plan Bay Area was based on exaggerated population projections appears to be fully justified by the actual population trends.
San Diego MSA
San Diego is the only major metropolitan region in the state that is not a combined statistical area. San Diego is unique in having exceeded its population projection for 2016. The margin was small, at 1.6 percent.
Sacramento CSA
The Sacramento CSA (California portion), fell short by a relatively small margin, gaining 6.3 percent compared to its 6.5 percent projection (a shortfall of 2.3 percent). Sacramento County, the area’s largest, fell only 1.2 percent short of its projection. The Sacramento CSA includes three metropolitan areas: Sacramento, Yuba City and Truckee.
Fresno CSA
Among the larger metropolitan regions, the most dramatic shortfall relative to projections was in Fresno, where the population grew 23.6 percent less than projected, for a gain of 4.9 percent. The Fresno CSA includes Fresno and Madera counties.
Balance of the State
Outside the major metropolitan regions, population growth was even less compared to projections. In the San Joaquin Valley, even without Fresno and the Stockton portion of the San Francisco Bay Area CSA, population growth was 24.9 percent below projections. In the rest of the state that growth was 26.2 percent below projection (Figures 1 and 2)


California’s Slower Growth Persists
All of this continues the comparatively rapid turnaround of California’s population growth since 2000. Between statehood in 1850 and 1990, California’s population grew no less than 18.6 percent (1970s) and up to 300 percent (1850s). After rising back to 25.7 percent in the 1990s, growth dropped to 10.0 percent in the 2000s, an average of one percent per year. During this decade, it seems unlikely that even that rate will be achieved.
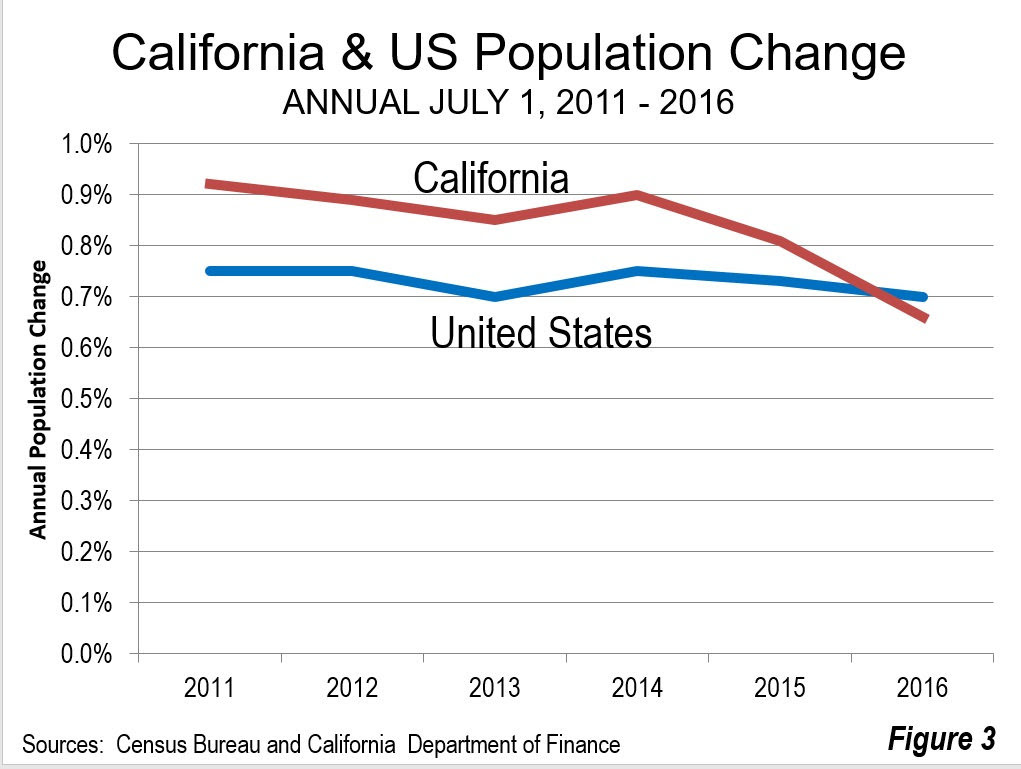
Since the 2000 census, California’s growth rate has dropped to only 0.84 percent, only a little above the national rate of 0.73 percent. Now it may be on track to start growing slower than the nation. In 2016 California’s growth rate fell below that of the nation for the first time in the decade coming in at 0.66 percent, compared to the national rate of 0.70 percent. Between 2011 and 2016, California’s average population increase was 18 percent above the national rate (Figure 3). Once a beacon for growth, California’s growth is more stagnant than in the past.


